The original name of Changwat Pathum Thani is Muang Sam Khok which was
founded during the Ayutthaya era and was the settlement for Mon People
migrating from Mohtama during the reigns of King Prasat Thong and King
Narai the Great. During the reign of King Taksin there were some additional
Mon families who moved into Ban Sam Khok which is now the location of
Amphoe Sam Khok. In the year 1815 when King Phra Phuttha Lertla made a
royal visit to Muang Sam Khok, a lot of the inhabitants of Sam Khok offered
him lotus flowers. He then gave to Sam Khok the new name of Prathum Thani.
Later on, the spelling was changed to be Pathum Thani during the reign
of King vajiravudh when he came to preside at the inauguration of the
Provincial Administrative Building (Sala Klang) in the year 1981. Pathum
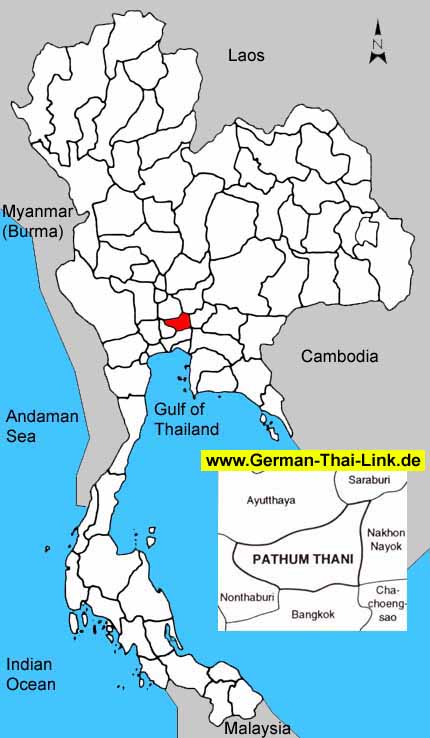
Thani is only 46 kilometers from Bangkok, conveniently accessible both
by land and water transport.
|
| General
Information |
| Area
sq km |
1,526
|
|
|
Anual
rainfall mm (2002) |
-
|
| Forest
Land (1999) |
-
|
-
|
Days
of rain (2002) |
-
|
| Farm
Land (1999) |
829
|
54.3 %
|
Mean
Temperature High/Low (2002) |
-
/
-
|
| Unclassified
Land (1999) |
697
|
45.7 %
|
BOI
Zone |
1
|
| Population
/ sq. km (2003) |
484
|
|
Gross
provincial product rank (2001) |
5
|
|
|
| Population |
2003 |
2002 |
2001 |
2000 |
1999 |
1998 |
1997 |
1996 |
| Male |
48.5 %
|
48.5 %
|
48.6 %
|
48.7 %
|
48.9 %
|
49.0 %
|
49.2 %
|
49.3 %
|
| Female |
51.5 %
|
51.5 %
|
51.4 %
|
51.3 %
|
51.1 %
|
51.0 %
|
50.8 %
|
50.7 %
|
| Total |
739,404
|
708,909
|
679,417
|
654,701
|
633,944
|
616,636
|
592,328
|
550,920
|
|
|
| Household
income (baht) |
2002 |
2000 |
1998 |
1996 |
1994 |
| Average
monthly income |
22,838
|
19,282
|
21,793
|
15,539
|
13,239
|
| Average
monthly expenditures |
17,836
|
17,239
|
16,515
|
12,091
|
11,308
|
| Voluntary
reserves |
21.9 %
|
10.6 %
|
24.2 %
|
22.2 %
|
14.6 %
|
| Monthly
income / Person |
6,920
|
5,843
|
5,889
|
3,884
|
3,229
|
| Average
household size |
3.3
|
3.3
|
3.7
|
4.0
|
4.1
|
|
|
| Gross
provincial product |
2001 |
2000 |
1999 |
1998 |
1997 |
1996 |
1995 |
1994 |
| Agriculture |
2.3 %
|
2.2 %
|
2.3 %
|
3.0 %
|
2.5 %
|
2.5 %
|
2.7 %
|
3.1 %
|
| Manufacturing |
70.9 %
|
68.8 %
|
73.9 %
|
71.7 %
|
69.2 %
|
64.1 %
|
66.0 %
|
64.2 %
|
| Construction |
3.2 %
|
2.2 %
|
1.4 %
|
1.3 %
|
4.4 %
|
12.2 %
|
11.2 %
|
11.0 %
|
| Transport
& communication |
2.6 %
|
3.1 %
|
1.5 %
|
2.4 %
|
2.6 %
|
2.4 %
|
2.0 %
|
1.8 %
|
| Wholesale
& retail trade |
4.0 %
|
6.2 %
|
5.3 %
|
5.6 %
|
5.7 %
|
5.1 %
|
5.1 %
|
5.4 %
|
| Services |
7.6 %
|
7.6 %
|
6.4 %
|
6.0 %
|
5.8 %
|
4.7 %
|
4.0 %
|
4.7 %
|
| Others |
9.4 %
|
9.9 %
|
9.2 %
|
10.0 %
|
9.8 %
|
9.0 %
|
9.0 %
|
9.8 %
|
|
|
|
|
|
|
|
|
|
| Total
(million baht) |
126,497
|
119,111
|
129,694
|
115,522
|
121,155
|
127,976
|
119,307
|
98,429
|
| GPP
per capita (baht) |
186,184
|
181,931
|
204,582
|
187,342
|
204,540
|
232,295
|
215,051
|
182,855
|
|
|
| Commercial
bank |
2003 |
2002 |
2001 |
2000 |
1999 |
1998 |
1997 |
1996 |
| No.
of offices |
75
|
74
|
70
|
74
|
61
|
61
|
56
|
51
|
| Deposits
(million baht) |
77,164
|
75,547
|
70,928
|
61,224
|
62,971
|
62,971
|
56,644
|
48,218
|
| Loans
(million baht) |
37,845
|
33,585
|
28,487
|
33,691
|
35,479
|
35,479
|
37,720
|
37,378
|
| Deposits
/ capita (baht) |
117,861
|
119,169
|
115,024
|
103,361
|
114,301
|
113,505
|
105,229
|
93,281
|
| Loans/deposits
ratio |
49.0 %
|
44.5 %
|
40.2 %
|
55.0 %
|
56.3 %
|
56.3 %
|
66.6 %
|
77.5 %
|
|
|
| Public
health |
2001 |
2000 |
1999 |
1998 |
1997 |
1996 |
1995 |
1994 |
1993 |
| No.
of hospitals |
21
|
19
|
19
|
19
|
20
|
16
|
13
|
8
|
8
|
| No.
of hospital beds |
2,791
|
2,531
|
2,369
|
2,112
|
2,308
|
1,653
|
999
|
475
|
475
|
| Avg.
Beds / Hospital |
132
|
133
|
124
|
111
|
115
|
103
|
76
|
59
|
59
|
| Capita
/ Hospital bed |
243
|
258
|
267
|
291
|
256
|
333
|
555
|
1,133
|
1,088
|
| No.
of physicians |
270
|
285
|
291
|
258
|
160
|
142
|
125
|
106
|
106
|
| Capita
/ Physician |
2,516
|
2,297
|
2,178
|
2,390
|
3,702
|
3,879
|
4,438
|
5,078
|
4,876
|
|
No. of dentists |
36
|
64
|
89
|
85
|
29
|
31
|
34
|
31
|
30
|
|
Capita / Dentist |
18,872
|
10,229
|
7,122
|
7,254
|
20,425
|
17,771
|
16,317
|
17,364
|
17,230
|
| No.
of nurses |
916
|
879
|
1,007
|
952
|
623
|
540
|
457
|
380
|
378
|
|
|
| Education |
2002 |
2000 |
1998 |
1996 |
1994 |
1993 |
| No.
of teachers |
-
|
5,374
|
5,615
|
5,027
|
5,160
|
4,688
|
| No.
of students |
-
|
112,058
|
113,726
|
108,493
|
99,093
|
99,228
|
| No.
of schools |
-
|
258
|
256
|
251
|
242
|
242
|
| No.
of classrooms |
-
|
3,717
|
3,644
|
3,513
|
3,486
|
3,405
|
| Ratio
: students / teacher |
-
|
20.9
|
20.3
|
21.6
|
19.2
|
21.2
|
| Ratio
: students / classroom |
-
|
30.1
|
31.2
|
30.9
|
28.4
|
29.1
|
|
|
| |
|