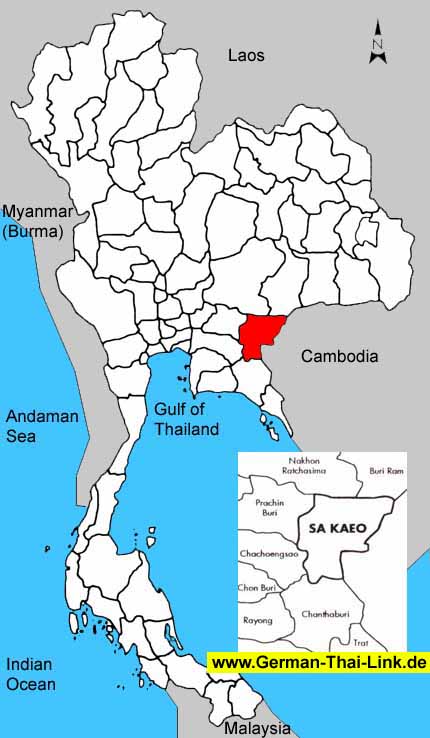
 Sa
Kaeo is a new province. It was founded in1997 by splitting Prachin Buri.
Please keep this in mind, when you have a closer look at the numbers below. Sa
Kaeo is a new province. It was founded in1997 by splitting Prachin Buri.
Please keep this in mind, when you have a closer look at the numbers below.
|
| General
Information |
| Area
sq km |
7,195
|
|
|
Anual
rainfall mm (2002) |
1,281
|
| Forest
Land (1999) |
1,198
|
16.7 %
|
Days
of rain (2002) |
132
|
| Farm
Land (1999) |
3,436
|
47.8 %
|
Mean
Temperature High/Low (2002) |
33.5
/
23.9
|
| Unclassified
Land (1999) |
2,561
|
35.6 %
|
BOI
Zone |
3
|
| Population
/ sq. km (2003) |
75
|
|
Gross
provincial product rank (2001) |
56
|
|
|
| Population |
2003 |
2002 |
2001 |
2000 |
1999 |
1998 |
1997 |
1996 |
| Male |
50.4 %
|
50.4 %
|
50.4 %
|
50.3 %
|
50.4 %
|
50.6 %
|
50.6 %
|
50.6 %
|
| Female |
49.6 %
|
49.6 %
|
49.6 %
|
49.7 %
|
49.6 %
|
49.4 %
|
49.4 %
|
49.4 %
|
| Total |
541,441
|
539,107
|
534,739
|
530,621
|
531,149
|
538,696
|
521,432
|
515,453
|
|
|
| Household
income (baht) |
2002 |
2000 |
1998 |
1996 |
1994 |
| Average
monthly income |
9,951
|
8,355
|
6,958
|
7,189
|
4,835
|
| Average
monthly expenditures |
6,871
|
7,215
|
6,773
|
6,728
|
5,112
|
| Voluntary
reserves |
31.0 %
|
13.6 %
|
2.7 %
|
6.4 %
|
-
|
| Monthly
income / Person |
2,843
|
2,198
|
1,880
|
2,114
|
1,343
|
| Average
household size |
3.5
|
3.8
|
3.7
|
3.4
|
3.6
|
|
|
| Gross
provincial product |
2001 |
2000 |
1999 |
1998 |
1997 |
1996 |
1995 |
1994 |
| Agriculture |
27.7 %
|
25.9 %
|
27.0 %
|
35.6 %
|
29.0 %
|
28.5 %
|
31.1 %
|
27.3 %
|
| Manufacturing |
6.5 %
|
6.4 %
|
5.6 %
|
5.5 %
|
4.9 %
|
5.1 %
|
3.9 %
|
5.0 %
|
| Construction |
2.5 %
|
4.0 %
|
4.2 %
|
3.9 %
|
7.5 %
|
11.0 %
|
8.6 %
|
6.2 %
|
| Transport
& communication |
3.4 %
|
3.4 %
|
3.7 %
|
3.6 %
|
3.2 %
|
3.5 %
|
3.7 %
|
4.8 %
|
| Wholesale
& retail trade |
28.7 %
|
28.4 %
|
28.5 %
|
22.3 %
|
28.7 %
|
26.1 %
|
25.9 %
|
28.2 %
|
| Services |
12.8 %
|
14.3 %
|
13.8 %
|
12.4 %
|
11.5 %
|
8.9 %
|
8.6 %
|
10.6 %
|
| Others |
18.4 %
|
17.6 %
|
17.2 %
|
16.7 %
|
15.2 %
|
16.9 %
|
18.2 %
|
17.9 %
|
|
|
|
|
|
|
|
|
|
| Total
(million baht) |
16,350
|
16,120
|
16,267
|
16,437
|
16,150
|
15,007
|
12,711
|
9,138
|
| GPP
per capita (baht) |
30,575
|
30,379
|
30,626
|
30,512
|
30,972
|
29,114
|
24,537
|
18,038
|
|
|
| Commercial
bank |
2003 |
2002 |
2001 |
2000 |
1999 |
1998 |
1997 |
1996 |
| No.
of offices |
19
|
19
|
20
|
22
|
20
|
20
|
19
|
19
|
| Deposits
(million baht) |
6,284
|
5,968
|
5,765
|
4,909
|
5,333
|
5,333
|
5,165
|
4,664
|
| Loans
(million baht) |
4,125
|
4,024
|
3,825
|
4,632
|
5,054
|
553
|
5,428
|
5,148
|
| Deposits
/ capita (baht) |
11,842
|
11,236
|
10,701
|
9,414
|
10,346
|
10,294
|
10,195
|
9,253
|
| Loans/deposits
ratio |
65.6 %
|
67.4 %
|
66.3 %
|
94.4 %
|
94.8 %
|
10.4 %
|
105.1 %
|
110.4 %
|
|
|
| Public
health |
2001 |
2000 |
1999 |
1998 |
1997 |
1996 |
1995 |
1994 |
1993 |
| No.
of hospitals |
7
|
7
|
8
|
7
|
6
|
6
|
6
|
6
|
6
|
| No.
of hospital beds |
576
|
539
|
556
|
503
|
388
|
364
|
340
|
340
|
340
|
| Avg.
Beds / Hospital |
82
|
77
|
69
|
71
|
64
|
60
|
56
|
56
|
56
|
| Capita
/ Hospital bed |
928
|
984
|
955
|
1,070
|
1,343
|
1,416
|
1,523
|
1,489
|
1,482
|
| No.
of physicians |
50
|
44
|
50
|
44
|
26
|
27
|
28
|
28
|
28
|
| Capita
/ Physician |
10,694
|
12,059
|
10,622
|
12,243
|
20,055
|
19,090
|
18,500
|
18,092
|
18,000
|
|
No. of dentists |
14
|
13
|
12
|
12
|
10
|
8
|
6
|
6
|
6
|
|
Capita / Dentist |
38,195
|
40,817
|
44,262
|
44,891
|
52,143
|
64,431
|
86,336
|
84,431
|
84,000
|
| No.
of nurses |
245
|
231
|
218
|
171
|
153
|
134
|
115
|
122
|
112
|
|
|
| Education |
2002 |
2000 |
1998 |
1996 |
1994 |
1993 |
| No.
of teachers |
-
|
4,589
|
4,524
|
4,395
|
4,100
|
4,000
|
| No.
of students |
-
|
103,140
|
101,793
|
100,430
|
95,768
|
90,564
|
| No.
of schools |
-
|
334
|
342
|
343
|
331
|
329
|
| No.
of classrooms |
-
|
3,880
|
3,891
|
3,755
|
3,564
|
3,215
|
| Ratio
: students / teacher |
-
|
22.5
|
22.5
|
22.9
|
23.4
|
22.6
|
| Ratio
: students / classroom |
-
|
26.6
|
26.2
|
26.7
|
26.9
|
28.2
|
|
|
| |
|